Last week at Friday Harbor, and a sobering week it's been. We've spent most of our time wrapping up our final projects to present on Wednesday, and I spent most of my time scrambling around trying to better understand bioinformatics. If I decide to work with bioinformatics in the future, auditing a microbiology course and intro genetics course wouldn't be a bad idea.
8/13/2012 -- 8/17/2012 -- Bioinformatics
For our last weekly assignment, we were to delve into the wonderful world of bioinformatics. We were interested in examining the gene-expression of a particular pathogen (QPX), and what genes would be expressed when exposed to two different levels of temperature. How we got to the QPX data is fantastically summed up in this picture drawn by our ta, Lisa Crosson. The large part of the work we did was performed in a cloud serviced based program entitled Galaxy. Bellow I've inserted the figures I made through out the week and some mac terminal commands, but more importantly (I believe) I've located some of the web services we discussed that could prove useful in my future work. I've also inserted a link to my favorite gene, a project we had to complete while in the course.
- Revigo -- A image generating program based of GO values.
- David -- a gene-enrichment analysis program. (Ana hates David)
- FigShare -- Open source science, baby!
My Favorite Gene -- Luciferase
 |
| QPX Pathway, Drawn by Lisa Crosson |
Images I created using various programs.


Terminal command lines for later referencing. - Green highlight indicates command, non highlight is a reference.
cd [drag in the file path your application is found in.]
./makeblastdb taxid
./makeblastdb -in /Users/fhlguest/Desktop/EIMD_blast/db/uniprot_sprot.fasta -out /Users/fhlguest/Desktop/EIMD_blast/db/uniprot_sprot -dbtype prot
./blastx -query /Users/fhlguest/Desktop/EIMD_blast/query/QPX_transcriptome_v1.fasta -db /Users/fhlguest/Desktop/EIMD_blast/db/uniprot_sprot
./blastx -help
./blastx -query /Users/fhlguest/Desktop/EIMD_blast/query/QPX_transcriptome_v1.fasta -db /Users/fhlguest/Desktop/EIMD_blast/db/uniprot_sprot -out /Users/fhlguest/Desktop/EIMD_blast/out/QPXtran_SPBlast -outfmt -evalue 1E-20 -max_target_seqs 1 -num_threads 2
8/9/2012 -- & 8/10/2012
The Next two days in lab revolved around us making our daily survival counts (24h & 48h) to help determine pahtogenicity. The count sheets from both days have been uploaded here. It should be noted that due to long lines at the microscopes, Sonia and I weren't able to get to our 48hour count until Saturday morning. There also were some discrepancies between Sonia and I on what was considered dead or alive. This is something that should be avoided in future experiments. After we completed our 48 hour count, we bleached our larvae and counted all the death!
 |
| 24 Hour Count |
 |
| 48 Hour Count |
8/8/2012 -- Math and Oyster setup!
Today we started our infection trials with our oyster larvae! The oyster counts with total volume; as well as, the required volume calculations have been attached bellow. Let the sickness begin!
 |
| Our Volume calculations with help from Elene |
 |
| Our Larval Counts with Volume in Control and Experiment |
8/7/2012 -- Streaking and Oyster Counting!
Today our Oyster Larvae finally came in. We mainly did some streaking setting up our argurs and practiced counting oyster larvae! Sonia was a big help in teaching me how to streak properly, we even have a great video of our lab partnership saved on youtube. This video was great documentation on our relationship! Here.
In the afternoon, Dr. Friedman instructed us on how to calculate our spec pH, which have been copied here.
<Insert Image from my phone>
8/6/2012 -- Akalinity Machine and Prep
The first day our oyster larvae did not show up, so instead we learned how to use the Akalinity and Ph Machine. These are my notes for setting up the Akalinity machine.
- Let the machine warm up the water.
- 15 - 30 Minutes
- Run everything at the same temperature, for stability purposes.
- Industry standard temperature is 25 degrees C.
- Can compute pH, Partial Pressure, and Alkalinity.
- Spec pH and Total Alkalinity are the best and least dependent matrices to use.
- Calculated 29.3 ppt and 22.0 degrees C - This was a place holder for something, not sure what though. Hopefully it will come back to me later.
- Make sure to Rinse the YSI Probe with DI water when finished.
- Calibration
- Add cup filled with acid to swirly arm thing.
- Rinse!
- We'll use 3 different levels of known pH, RINSE AFTER EACH ONE.
- The pH Meter should not touch the side or the bottom of the cup!
- 8.43 ppt - Better than Dr. Friedman could do!
8/6/2012 -- 8/10/2012 -- Ocean Acidification
For this week, we were interested in observing the effects of ocean acidification on oyster larvae. We were specifically interested to see how it could influence the pathogenicity of several isolated strains of vibrio tubiashi. We also wanted to know if the strains that were sent were equally pathogenic, and if the use of Aeromonas media A 199 improved oyster health.
7/30/2012 - 8/3/2012 -- Laby Field Survey
For our second week, we spent most of our lab time working out in the field and analyzing our data in the afternoons. We also spent some lab time figuring out and discussing the how we wanted to try and run our innoculation trials. This involved helping set up several mesocosms, that needed to be cleaned properly before we could use them. We ended up not actually using the mesocosms for our trials, but it's always fun to learn how to set up lab equipment. For most of our field sampling, I was working with Courtney collecting water quality and gps data. The remainder of the class was broken up into two teams Shoot Density Measurements and counting Disease Prevalence. Most people worked with the same partners each day; however, everyone was able to practice doing a little bit of everything. A picture of our water quality work has been uploaded below, note the freezing state I'm in. Not to self, If you ever do something like this again in the Pacific Northwest; bring a wetsuit.
Eel Grass Sampling Protocol can be found here.
 |
| Mesocosm that Gregor and I worked on. |
8/2/2012 -- False Bay
We had to False Bay to complete our samples, and we timed the tide better.
8/1/2012 -- Picnic Cove
The last site we sampled, and by far the filthiest site. We observed in our counts less eggs/adult snails here as well. Island is owned by three convicts on nuns,
Sandy Wyllie-Echeverria had to email them the night before so we could go out and sample.
7/31/2012 - Beach Comber
Beach Comber was our second sampling site. By the second day, everything was running like a nice routine. We didn't have tide issues, although it was the deepest sight of all three and by virtue the water seemed to be the coldest.
7/30/21 -- False Bay
Our first time out at False bay, and I'll never forget how cold the wind was. It cut through you like a knife through butter, man. We made it to our site around 8:15 which was the lowest point of low tide. Next time, it would be better to get there and hour before low tide. The tide creeps in fast at false bay so having a little extra breathing room would have been great. This was the main reason we had to return to False Bay. For my part I mainly worked on water quality data with Courtney. Each day after we would finish I would walk around the perimeter of our transects show that would get look plot our maps in ArcGIS. After examining the data and the lack of access to some spatial analysis functions, we decided to scrap any addition portion of GIS.
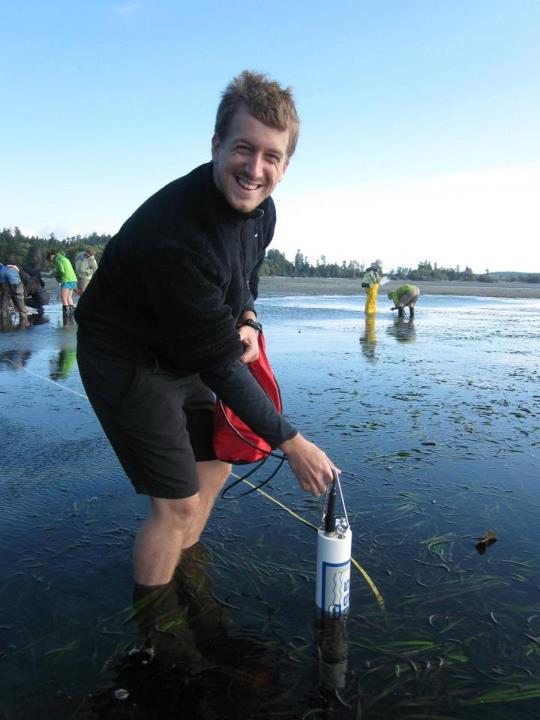 |
| Sampling for Water Quality in False Bay |
7/27/2012 -- With Gel Electrophoresis comes Peace & Understanding
Today we bear fruits of our PCR labors and tears from the previous. We did this through gel electrophoresis our gel results are pasted here.

Here is a Table for our PCR Order.
As you can see from the picture, there was some pretty bad blurring on our ladders. This indicates the the ladder we used was poor, perhaps due to it's age, and essentially renders our PCR useless. This is what Sonia explained to me today.
7/26/2012 -- DNA Extraction, the beginning of my first PCR experience!
Today we left blood in the water, and I cut my PCR teeth into my metaphorical microbial gum skill set. The goal of our PCR is to try and detect and amplify any Rickettsia DNA that could be found in our Armina's digestive gland. PCR is a great process to try in with some quality histology slides.
Accession number - 8 - 2 - 10 -Armina
Some notes from the extraction that took place in the morning.
- There was some bubbling due to poor pipetting technique, this can throw off my measurements.
- The pipet tip fell off, and could have poked through our filter. Something for us to be aware of as we think about our results.
Notes from our afternoon DNA Extraction.
- We used a Universal Primer (EUB) A/B.
- make sure you make your calculations and solutions with given 10% extra for pipetting errors.
- We are going to need to need 12 tubes total.
- Always start with your cheapest ingredients first if you can, that way if you make an error you haven't lost the big bucks.
PCR Has also been described as baking a cake. I've added the Cake Recipe that was described in our case study hand out.
Dr. Carolyn's Friedman Betty Crocker Guide to baking your PCR (DNA Extraction and PCR)
- Pre-label all the microcentrifuge tubes you will need for this procedure. You will throw away most tubes used, so you need to only minimally label these tubes. You will need a final 1.5 mL microcentrifuge tube, please label this with the following information: your sample accession #, your initials, and the date. Please put the sample # on both the top and the side of the tube. Remember to always run a BLANK extraction as a negative control.
- Remove tissue from ethanol using good sterile technique and cut off a small piece of tissue approximately the size of ½ of a pencil eraser. Weigh the tissue and record in your notebook. Mince the tissue into small pieces and place them into a 2 mLmicrocentrifuge tube. Take care not to cross-contaminate samples.
- Add 1.4 mL Buffer ASL to each sample. Do this by adding 700 µl of Buffer ASL, vortexing for a minute and then adding another 700 µl of Buffer ASL. Once all ASL has been added, vortex continuously for 1 min or until the sample is thoroughly homogenized. Please note: It is important to vortex the samples thoroughly as it will insure maximum DNA concentration.
- Heat for 5 min at 70º C.
- Vortex for 15 s and centrifuge sample at full speed for 1 min to pellet tissue particles.
- Pipet 1.2 mL of the supernatant into a new 2 mL microcentrifuge tube and discard the pellet.
- Add 1 InhibitEX tablet to each sample and vortex immediately and continuously for 1 min or until the tablet is completely dissolved. Incubate for 1 min at room temperature to allow inhibitors to absorb the InhibitEx matrix.
- Centrifuge sample at full speed for 3 min to pellet inhibitors bound to InhibitEX.
- Pipet all the supernatant into a new 1.5 mL microcentrifuge tube and discard the pellet. Centrifuge the sample at full speed for 3 min. *in this step, the transfer of small quantities of pelleted material will not affect the procedure*
- Pipet 15 ul Proteinase K into a new 1.5 mL microcentrifuge tube.
- Pipet 200 ul supernatant from step 9 into the 1.5 mL microcentrifuge tube containing Proteinase K.
- Add 200 µl Buffer AL and vortex for 15s. *DO NOT ADD Proteinase K directly to Buffer AL* It is essential that the sample and Buffer AL are thoroughly mixed to form a homogenous solution.
- Incubate at 70 ºC for 10 min.
- Remove your samples from the incubator and briefly centrifuge. Add 200 µl of 95% molecular grade ethanol to the sample and vortex for 15 seconds. Briefly centrifuge the tubes.
- Carefully apply this mixture to a QIAamp spin column. If a white precipitate has formed, make sure to add this to the column. Do not wet the rim of the spin column (this can allow cross-contamination of samples in the centrifuge). Centrifuge at 8000 rpm for 1 minute.
- Place the QIAamp spin column in a clean 2 mL collection tube.
- Carefully open the QIAamp spin column and add 500 µl of buffer AW1 without wetting the rim. Centrifuge at 8000 rpm for 1 minute.
- Discard the 2 mL collection tube containing the buffer and place the spin column into a new collection tube.
- Open the spin column and add 500 µl of buffer AW2 without wetting the rim. Centrifuge at full speed for 3 minutes.
- Place the spin column into your final microcentrifuge tube, add 100 µl of buffer AE to the column and allow to incubate at RT for 5 minutes.
- Centrifuge at 8000 rpm for 1 minute.
- Remove the spin column and throw it away. You now have a tube of DNA!
- Once we've extracted our DNA, we're ready to begin the assembly!
- Calculate the volumes you need for your PCR reactions (see master mix recipes below). Make at least 10% more than you need so that you do not run out of master mix. All calculations should be recorded in your notebook.
- Wipe down bench with 10% bleach.
- To a 1.5 mL tube add all reagents except the DNA template.
- Vortex briefly (pulse).
- Label the PCR tubes with your sample # and primers. Label two tubes (–) for your negative control and two (+) for your positive control.
- For WS-RLO recipe, add 18 μL of master mix to each of the PCR tubes.
- For generic recipe, add 23 μL of master mix to each of the PCR tubes.
- Add 2 µL of PCR water to each negative control and cap.
- Add 2 μL of template DNA to each tube and cap, taking care not to cross contaminate between samples.
- Add 2 µL of known positive template into the positive control tubes.
- Vortex briefly (pulse) and spin down.
- Run thermal profiles for cPCR.
Below is the calculated recipes mentioned in step 24.
| Generic Recipe |
uL/per reaction |
Total |
| stock |
12.5 |
62.5 |
| primer (FWD) |
0.8 |
4.0 |
| primer (REV) |
0.8 |
4.0 |
| water |
7.4 |
37.0 |
| BSA |
1.5 |
7.5 |
| 115 ul |
| WS - Recipe |
uL/per reaction |
Total |
| 5x Buffer |
4 |
20 |
| MgCl2 |
1.2 |
6 |
| BSA |
.8 |
4 |
| H20 |
11.08 |
55.4 |
| dNTP's |
.4 |
2 |
| RA 3-6 |
.1 |
.5 |
| RA 5-1 |
.1 |
.5 |
| TAQ |
.32 |
1.6 |
| 90 |
7/25/2012 -- Armina Dissection
For our morning labs we started dissecting our infected Armina. I've copied the table from the whiteboard into my notebook containing the accession numbers for our organisms.
| Name |
Accession Number |
Total Length (mm) |
Total Weight (g) |
| Lisa |
12 - 1 - 1 |
42.0 |
4.7 |
| Lisa |
12 - 1 - 2 |
56.5 |
5.5 |
| Amy |
12 - 1 - 3 |
40.0 |
5.6 |
| Jamie |
12 - 1 - 4 |
36.7 |
3.2 |
| Jenna |
12 - 1 - 5 |
36.4 |
4.3 |
We also cut into a portion of the animals digestive gland. Half of the tissue sample was placed into a histology cassette with the side of interest facing down. Using a solvent resistant histology pen, we placed our cassette into a Invertebrate Davidson's fixative for a 24 hour time period. The other half of our sample would be used as in PCR for testing for pathogen presence in the DNA.
7/24/2012 -- Introduction to Histopathology
Today's Lab was the first in exposing us to the wonderful world of histopathology, also known as the gold standard for disease diagnosis. However, before we could practice our diagnostics skills, we were asked to play the role of the butcher and dissect some marine invertebrates. For our part, we dissected an Oyster and Sea Cucumber pictured below. Also pictured bellow is hand drawn notes from my lab note book (Sorry for the poor quality). We then observed some prepared Oyster histology slides, so that we could properly determine disease and health tissue samples. This played into our afternoon lab as we spent time preparing our own histology slides and the first steps in PCR Analysis.
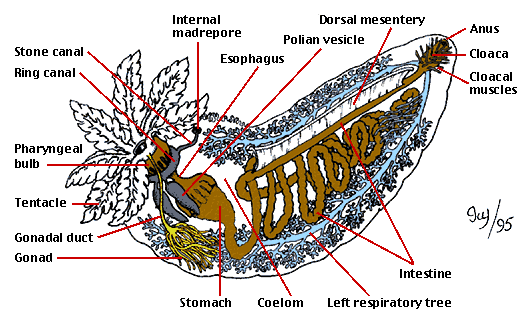 |
| SeaCucumber Anatomy |
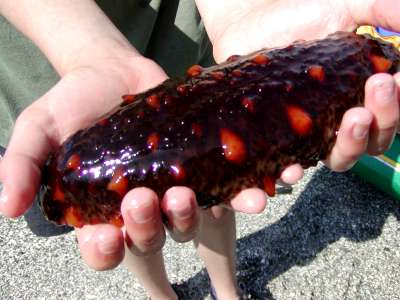 |
| Sea Cucumber |
 |
| Sea Cucumber Drawing |
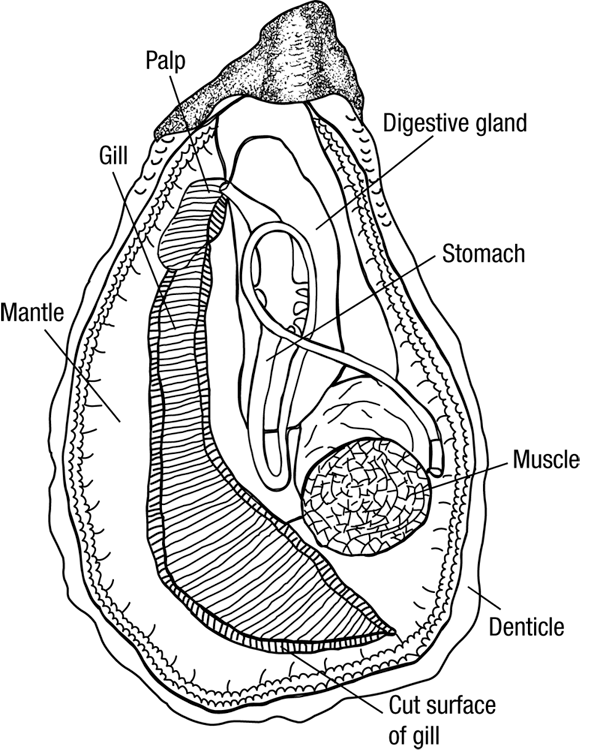 |
| Oyster Anatomy |
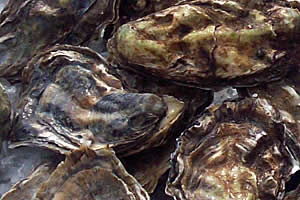 |
| Live Oysters, delicious and deadly |
 |
| Oyster Drawing |
For the afternoon we spent our time familiarizing our selves with histopathology. Some of the tissues I looked at from the abalone we cut apart were digestive gland, heart cells, and inetestinal gland. We also looked at some prepared histology slide containing Rickettsia! This way we would know it when we saw it!
 |
| This is what Rikettsia looks like in the post esphogaus tissue! |
Extras from Lab 1
Sea Cucumber -- The Animated Tv Show